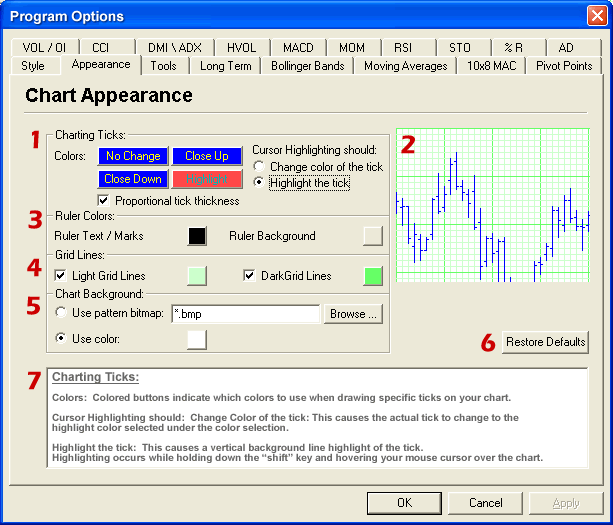
Program Options - Chart Tick Drawing Options

- Charting Ticks:
- Colors: Colored buttons indicate which colors to use when drawing
specific ticks on your chart.
- Cursor Highlighting should: Change Color of the tick: This causes
the actual tick to change to the highlight color selected under the color
selection.
- Highlight the tick: This causes a vertical background line
highlight of the tick. Highlighting occurs while holding down the
“shift” key and hovering your mouse cursor over the chart.
- Proportional tick thickness: Causes ticks to be drawn with thicker
pens, so they appear to be thicker and easier to see when enlarged. It is
important to have this option selected when printing charts, otherwise ticks
will appear very thin.
- Preview Window:
- Ruler Colors:
- Ruler Text / Marks: Indicates the color used for the ruler lines
and text.
- Ruler Background: Indicates the color used for the background of
the rulers.
- Grid Lines: The check boxes indicate whether or not we display those
particular grid lines, and the color boxes indicate which colors we display
those grids with.
- Chart Background: Your chart can be displayed with a solid color
background, or you can choose to use a bitmap image as your background. If you
use a bitmap, the image will be tiled. An example would be a small 1”x1”
square graphic, possibly resembling a different grade or style of paper.
- Restore Defaults:
- Documentation:

